Spring 2025 Final Projects
Please enjoy the final projects of students during the Spring 2025 semester. —
Simulating Tidal Waves with Gravitational Physics
Group Members: Deacon Carreon and Olivia Silvia
The goal for this project was to model the tides of the Earth-Moon-Sun system. To do this, we simulated the positions of all three objects using equations of gravity and mechanics. With these distances we simulated the tidal wave heights at any inputted latitude on the Earth, ultimately putting it into an animation, based on the function parameter of time.
Slide 1 of 7
Mass-Radius Relations of Neutron Stars
Group Members: Eva Li, Serina Mummert
This project investigates the mass-radius relationship found in neutron stars, the most dense observable objects known to astronomers today. Utilizing python, we model theoretical predictions for neutron star structures based upon packages including the readily found solutions to the Tolman-Oppenheimer-Volkoff(TOV) equations and various equations of state(EOS).
We compare these theoretical calculations to our observational data collected from pulsars, x-ray binaries, and gravitational wave events. The goal is to enhance our understanding of and find meaningful connections between observed neutron stars and known theoretical predictions.
Slide 1 of 11
Dark Matter Distribution of a Quasar-Galaxy Lensing System
Group Members: Charlie Beckner
My project is focused on plotting the distribution of dark matter of the galaxy in the gravitational lensing system, DES J0408-5354. The main galaxy is bending the light of a distant quasar behind it, creating three distinct lensing images and a clear Einstein radius arching around the galaxy. To do this, I will utilize data about the system to find the mass of the dark matter enclosed within the Einstein radius. I will then fit a mass-density model to find the scale radius and scale density which I will then use to plot the density as a function of radius from the center of the galaxy to visualize the distribution. To confirm my model is properly fitting the data, I have generated mock test data.
Slide 1 of 6
Rotation Curve of the Milky Way Evidence for Dark Matter Halos
Group Members: Max Velasquez and Xavier Silva
This project aims to explore and simulate our galaxy’s rotation curve, comparing theoretical Keplerian models with observed velocity data to illustrate the need for dark matter. We used real data from Eilers et al. (2019) on the Milky Way’s circular velocity curve, the project analyzes how star velocities behave at different galactic radii.
Slide 1 of 6
Faraday’s Law
Group Members: Aviva Franklin
In this project, I will be measuring the motion of a spring oscillating at 60 degrees, and then fit that data to different models to determine the best equation of motion for the system. This will involve data generation, data analysis, finding a curve of best fit with errors, and analyzing the results.
Slide 1 of 11
3D Snake with Laser Guns
Group Members: Carsen Dunn and Mark Moreno
Slide 1 of 6
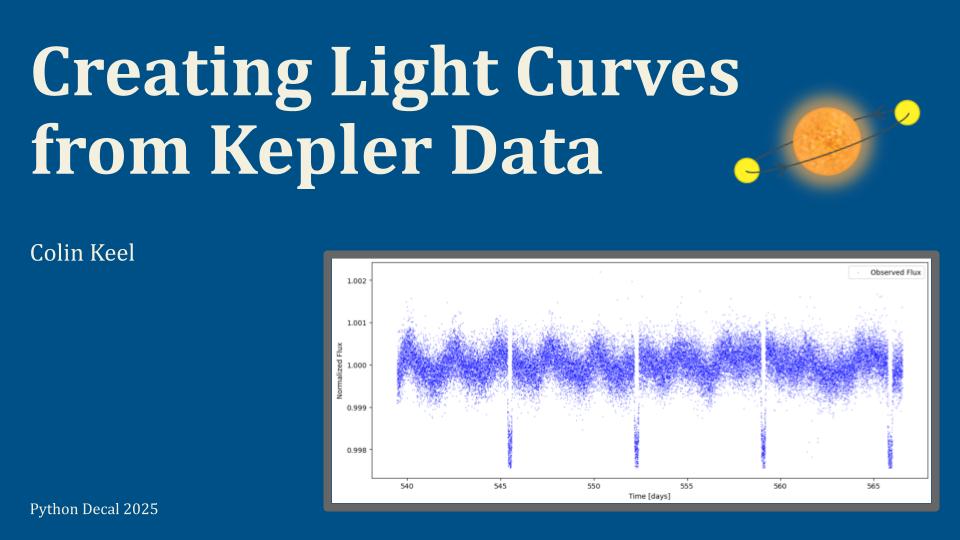
Creating Light Curves from Kepler Data
Group Members: Colin Keel
The goal of this project was to create a program that takes in data from the Kepler Space Telescope and turns that data into a light curve for a specified Kepler target from which brightness dips associated with exoplanet transits can be clearly observed. The packages used in this project are numpy, matplotlib.pyplot, lightkurve, batman, and scipy.optimize. The two that I found to be the most useful were lightkurve and batman; however, these were both unfamiliar to me upon starting this project, so a good amount of time was spent figuring out how to use them. Lightkurve was used to search for and download the data, filter the data and remove outliers, and stitch the data into actual light curves. Batman was used to import the Mandel and Agol transit model that was used to fit the data.
Slide 1 of 6
Gravity Knights: FIGHT GRAVITY WITH OUR ROCKET LANDING SIMULATOR!!!
Group Members: Jean Gonzalez and Audrey Lee-Gardner GitHub Repository: https://github.com/Jeans617/Python_project_folder
Our initial goal with Gravity Knights was to create a 2D arcade-style game simulating real-world physics, but we weren’t initially sure what the premise of our game would be. We initially thought of making a game in which you shoot enemies with a spaceship, but this concept has been done so many times before and wouldn’t lend well to the “physics-based” concept we had. With this realization, we finally came up with the idea of having to fight the pull of gravity with an opposing force, a simple physics concept that most players should be familiar with, but implemented in a challenging way. Once we had the concept for our game, our main goal was to implement it in a way that was user-friendly, fun to play, and even educational.
Slide 1 of 7
Analyzing Orbital Properties of KOI Systems
Group Members: Kaitlyn Le
In this final project, I analyzed the relationship between orbital properties among the KOI planetary systems. The goal of this project was to discover trends with the relationships between planetary mass, radius, and orbital period by applying statistical methods, model fitting, and residual analysis. I explored the mass-period and radius-period relationships while utilizing power-law models to fit the data.
Slide 1 of 8
Modeling The Relative Chemical Abundances From Type 1A Supernova Explosions
Group Members: Shivani Kulkarni and Melanie Miu
For this project, we used data from Type 1a supernova explosions taken from the Carnegie Supernova Project (see citation at the end) to create a model that will estimate the relative chemical abundances of a Type 1a supernovae. This project includes the use of graphing packages as well as isolating data to figure out which elements are being formed specifically in each explosion. We used this data to graph a single spectra for a single supernova explosion to see how we can extract information about the chemicals released in the explosion and then create our final model of the relative abundances of all the supernovae in our data collection. We did this by using python and python libraries (will go over in more detail in Methods section) to combine the data and take the average of the elemental fluxes.
Slide 1 of 10
Near Earth CometSimulator
Group Members: Sareena Mann
There are about 37,000 active Near Earth Objects, and about 2,500 of which are considered potentially hazardous (CNEOS). Therefore, understanding their orbits and how factors such as eccentricity affect their potential trajectories. In this project report, I outline the approach I took to analyze the trajectories of Near Earth comets. Near Earth objects are defined as objects with trajectories within 1.3 AU of the Sun and therefore within 0.3 AU of the Earth’s orbit (UNOOSA). I will use data provided by NASA’s Open Portal to animate the orbits of 160 Near Earth Orbits and to simulate how including random noise in the data affects the predicted orbits.
Slide 1 of 11
HWC: ESI and CMF of Exoplanets
Group Members: Brandon Pestoni
Within the Habitable Worlds Catalog (HWC), there are over 5000 exoplanets recorded with most having specific physical parameters cataloged that determine their specificity in terms of what kind of exoplanet it is and how it compared to planets that we know of in our own solar system. They have different data sets that are either reduced based on certain physical parameters but for the sake of this project, I decided to take the raw data set and do the filtering on my own, as we will see in the coming pages.
Slide 1 of 8
Solar Spectral Irradiance with blackbody radiation and Plank’s law
Group Members: Moe Shinkawa
For this project, I focus on investigating the solar spectrum by considering it as a blackbody and using Plank’s function. I utilize a data archive of solar spectral irradiance (SSI) measured from a wavelength range from 200 nm to 2400 nm provided by University of Colorado’s Laboratory for Atmospheric and Space Physics and obtained by its Total and Spectral Solar Irradiance Sensor (TSIS-1) ¹. I choose the daily (24h) SIM data.
Slide 1 of 9
Awesome Arches: Exploring the Life & Luminosity of Stars
Group Members: Meghan Ke
Because the CMD shows virtually no cool, red giants and the H–R diagram places almost all stars on the upper main sequence, the cluster must be very young—younger than about 3 Myr. The hottest members, sitting near log T ≈4.5 and log L/L⊙ >5, are massive O- and B-type stars whose entire life-spans are only ∼ 2–10 Myr. Their presence, together with the absence of evolved cooler stars, implies the Arches cluster formed recently and that many of these massive stars are still in the hydrogen-burning phase.
The constant-radius lines in the H–R diagram further tell us that most stars are presently no larger than about 10−20 R⊙; as they exhaust core hydrogen they will quickly climb above the 20 R⊙ line, becoming blue super-giants and, soon after, supernovae. Hence we predict that within a few million years the cluster will begin to experience its first supernova explosions and strong stellar-wind feedback, dramatically reshaping its internal gas and halting further star-formation.
Slide 1 of 8
Patterns of Weather
Group Members: Shadman Khan
To see if there really was a pattern in weather as other sources claim. See if there is a difference for places with various factors such as population and location.
Slide 1 of 10
Simulating Electric Fields in Electric Fish
Group Members: Diana Collier and Luke McGinn
We created a synthetic dataset that mimics the electric organ discharge of a wave-type fish. Modeled how signal changes when an object is nearby. We simulated the electric field using the finite difference method to solve Laplace’s equation
Slide 1 of 8
Solar System PERSPECTIVE CHANGE
Group Members: Chienyu Sun
The objective of this project is to create an animation of the solar system, viewed from the perspective of a planet. The choice of planet is based on user input. The final result is a 2d animation of the system, coded in Jupyter Notebook and saved as a gif. The project is split into two parts: the solar system and the perspective change.
Slide 1 of 7
Determining the Value of the Hubble Constant
Group Members: Forrest Johnson and Elliot Dutnall
Our objective for this project was to take data regarding the apparent recessional velocities and proper distances of celestial objects to calculate the Hubble Constant, using data gathered from the NASA/IPAC Extragalactic Database Master List of Galaxy Distances. To do this we decided to reformat the data to a Google Sheet, which we then downloaded as a .csv file, which we then imported into a pandas dataframe, where we could apply a quality filter to the data and be able to use matplotlib.pyplot to graph the data with a curve fit. We worked with two datasets, one having data from galaxies with recessional velocities less than one eighth the speed of light, and the other with recessional velocities greater. After sorting through and cleaning the data, we graphed and curve fitted each of the data frames individually using scipy.optimize, before combining them and taking the curve fit of both. This led to us producing three separate graphs of our data to present. In addition, we used scipy.statistics to calculate the Pearson correlation coefficient (R2), which enabled us to determine how well our data fits a linear line of best fit.
Slide 1 of 5
Michaelis–Menten Kinetics
Group Members: Sarai Garcia
To start off, the base of my project is Michaelis- Menten kinetics in biochemistry.
Slide 1 of 4
Space Puzzle Game
Group Members: Jordan Gomez
For my final project I chose to create a game using the pygame library, a library built for creating games in python. My project can be described as a puzzle game where the player uses keyboard inputs in order to change the position of environmental objects such as platforms and enemies.

Slide 1 of 7
Double Pendulum Simulation
Group Members: Michael Birmingham
The Double Pendulum is a famous nonlinear dynamical system which exhibits chaotic motion from slight adjustments in starting conditions. I accurately simulated and animated a double pendulum using python and numerical methods to track its motion. I used different libraries in order to instantaneously solve differential equations that govern the system. The visualization shed light on the concepts of the conservation of energy, periodic motion, chaotic motion, and more.
Slide 1 of 7
Verifying G using Exoplanet Data
Group Members: Elizabeth Hung and Mustafa Abuzahriyeh
The purpose of this project was to find multiple values of G using Kepler’s Third Law for different exoplanets and see how this compares to the established value of G. The values of the force of gravity were also plotted in an attempt to see how this compares to the established force being proportional to 1/𝑥^2.

Slide 1 of 8
Mapping Large-Scale Structure of the Universe Using DESI Data
Group Members: Aryan Gupta
The goal of this project was to analyze the large-scale structure of the universe using publicly available data from the Dark Energy Spectroscopic Instrument (DESI) First Data Release (DR1). The project involved generating synthetic galaxy data, applying quality filtering to real DESI galaxies, model fitting, and interpreting the results. I used Python throughout the project, relying mainly on NumPy, Pandas, Matplotlib, SciPy, and Astropy libraries.
Slide 1 of 9
Other Projects
Visualizing Baryon Acoustic Oscillations (BAOs)
Group Members: Amelia Cahill
Metabolic Guessing Game: Progression to Type 2 Diabetes
Group Members: Tushita Wadhawan GitHub: https://github.com/twadhawan0001/tushita decal For my final project, I developed a Python-based interactive guessing game that teaches users about the progression of metabolic diseases, specifically focusing on type 2 diabetes. This project combines educational biology content with programming to create an engaging and interactive experience. The game prompts users to guess key biology terms related to the disease timeline and rewards correct or completed guesses with visual animations that illustrate the physiological changes occurring in the body
Shooting Game
Group Members: Yuang Li
I plan to make a mini shooting game, there will be bot enemies shooting at you, and you have to also avoid obstacles from getting HP down. You get scores by destroying enemies. There’s also a time limit. Win/lose condition: win by survive, lose if you’re not. It could be spaceships or just playing volleyballs.
Interactive Simulation
Group Members: Arshia Tomar GitHub: https://github.com/a-tomar9/arshia_decal
For my Python Decal Final Project, I wanted to create an interactive simulation, structured with simple visuals, that allows users to design planetary parameters to explore what conditions would be on said planet, exploring possibilities of life. The simulation combines core scientific ideas that are derived from astrobiology, planetary science, and astronomy, all combining into one Python file. I wanted this project to be both engaging and educational, with tools that help visualize and interact with certain habitability parameters of a fictional planet orbiting around a star of the user’s choosing.
Untitled
Group Members: Mia Hernandez-Peng
For my final project, I downloaded data from NASA’s exoplanet archive, chose 3 pairs of traits to plot and analyze, then fitted each plot to a curve. I then added error bars and represented the data trends I saw using sound. Finally, I generated random test data and calculated the chi-squared values for my equations to evaluate the fit. To complete this, I used numpy, matplotlib, pandas, and musicpy.
Power Output
Group Members: Giancarlo Ursellii
Variations in Black hole mass
Group Members: Xochilt Arrioja